Metrics
Fireactions provides Prometheus metrics for monitoring.
The metrics can be enabled by setting the metrics.enabled configuration option to true. The metrics are exposed on the /metrics endpoint on the address and port specified in the metrics.address and metrics.port configuration options.
Metrics
The following metrics are available, excluding the default Prometheus metrics:
| Metric Name | Type | Description | Labels |
|---|---|---|---|
fireactions_server_up |
Gauge | Whether the server is up (1) or down (0) | None |
fireactions_pools_total |
Gauge | Total number of pools | None |
fireactions_pool_runners_current |
Gauge | Current number of running runners in a pool | pool, organization |
fireactions_pool_runners_desired |
Gauge | Desired number of runners in a pool (replicas) | pool, organization |
fireactions_pool_status |
Gauge | Status of a pool (0 = paused, 1 = active) | pool |
fireactions_pool_scale_requests_total |
Counter | Number of scale API requests for a pool | pool |
fireactions_scale_operations_total |
Counter | Total number of individual scale operations | pool, organization, direction, status |
fireactions_scale_duration_seconds |
Histogram | Time taken to complete a scale operation | pool, organization, direction |
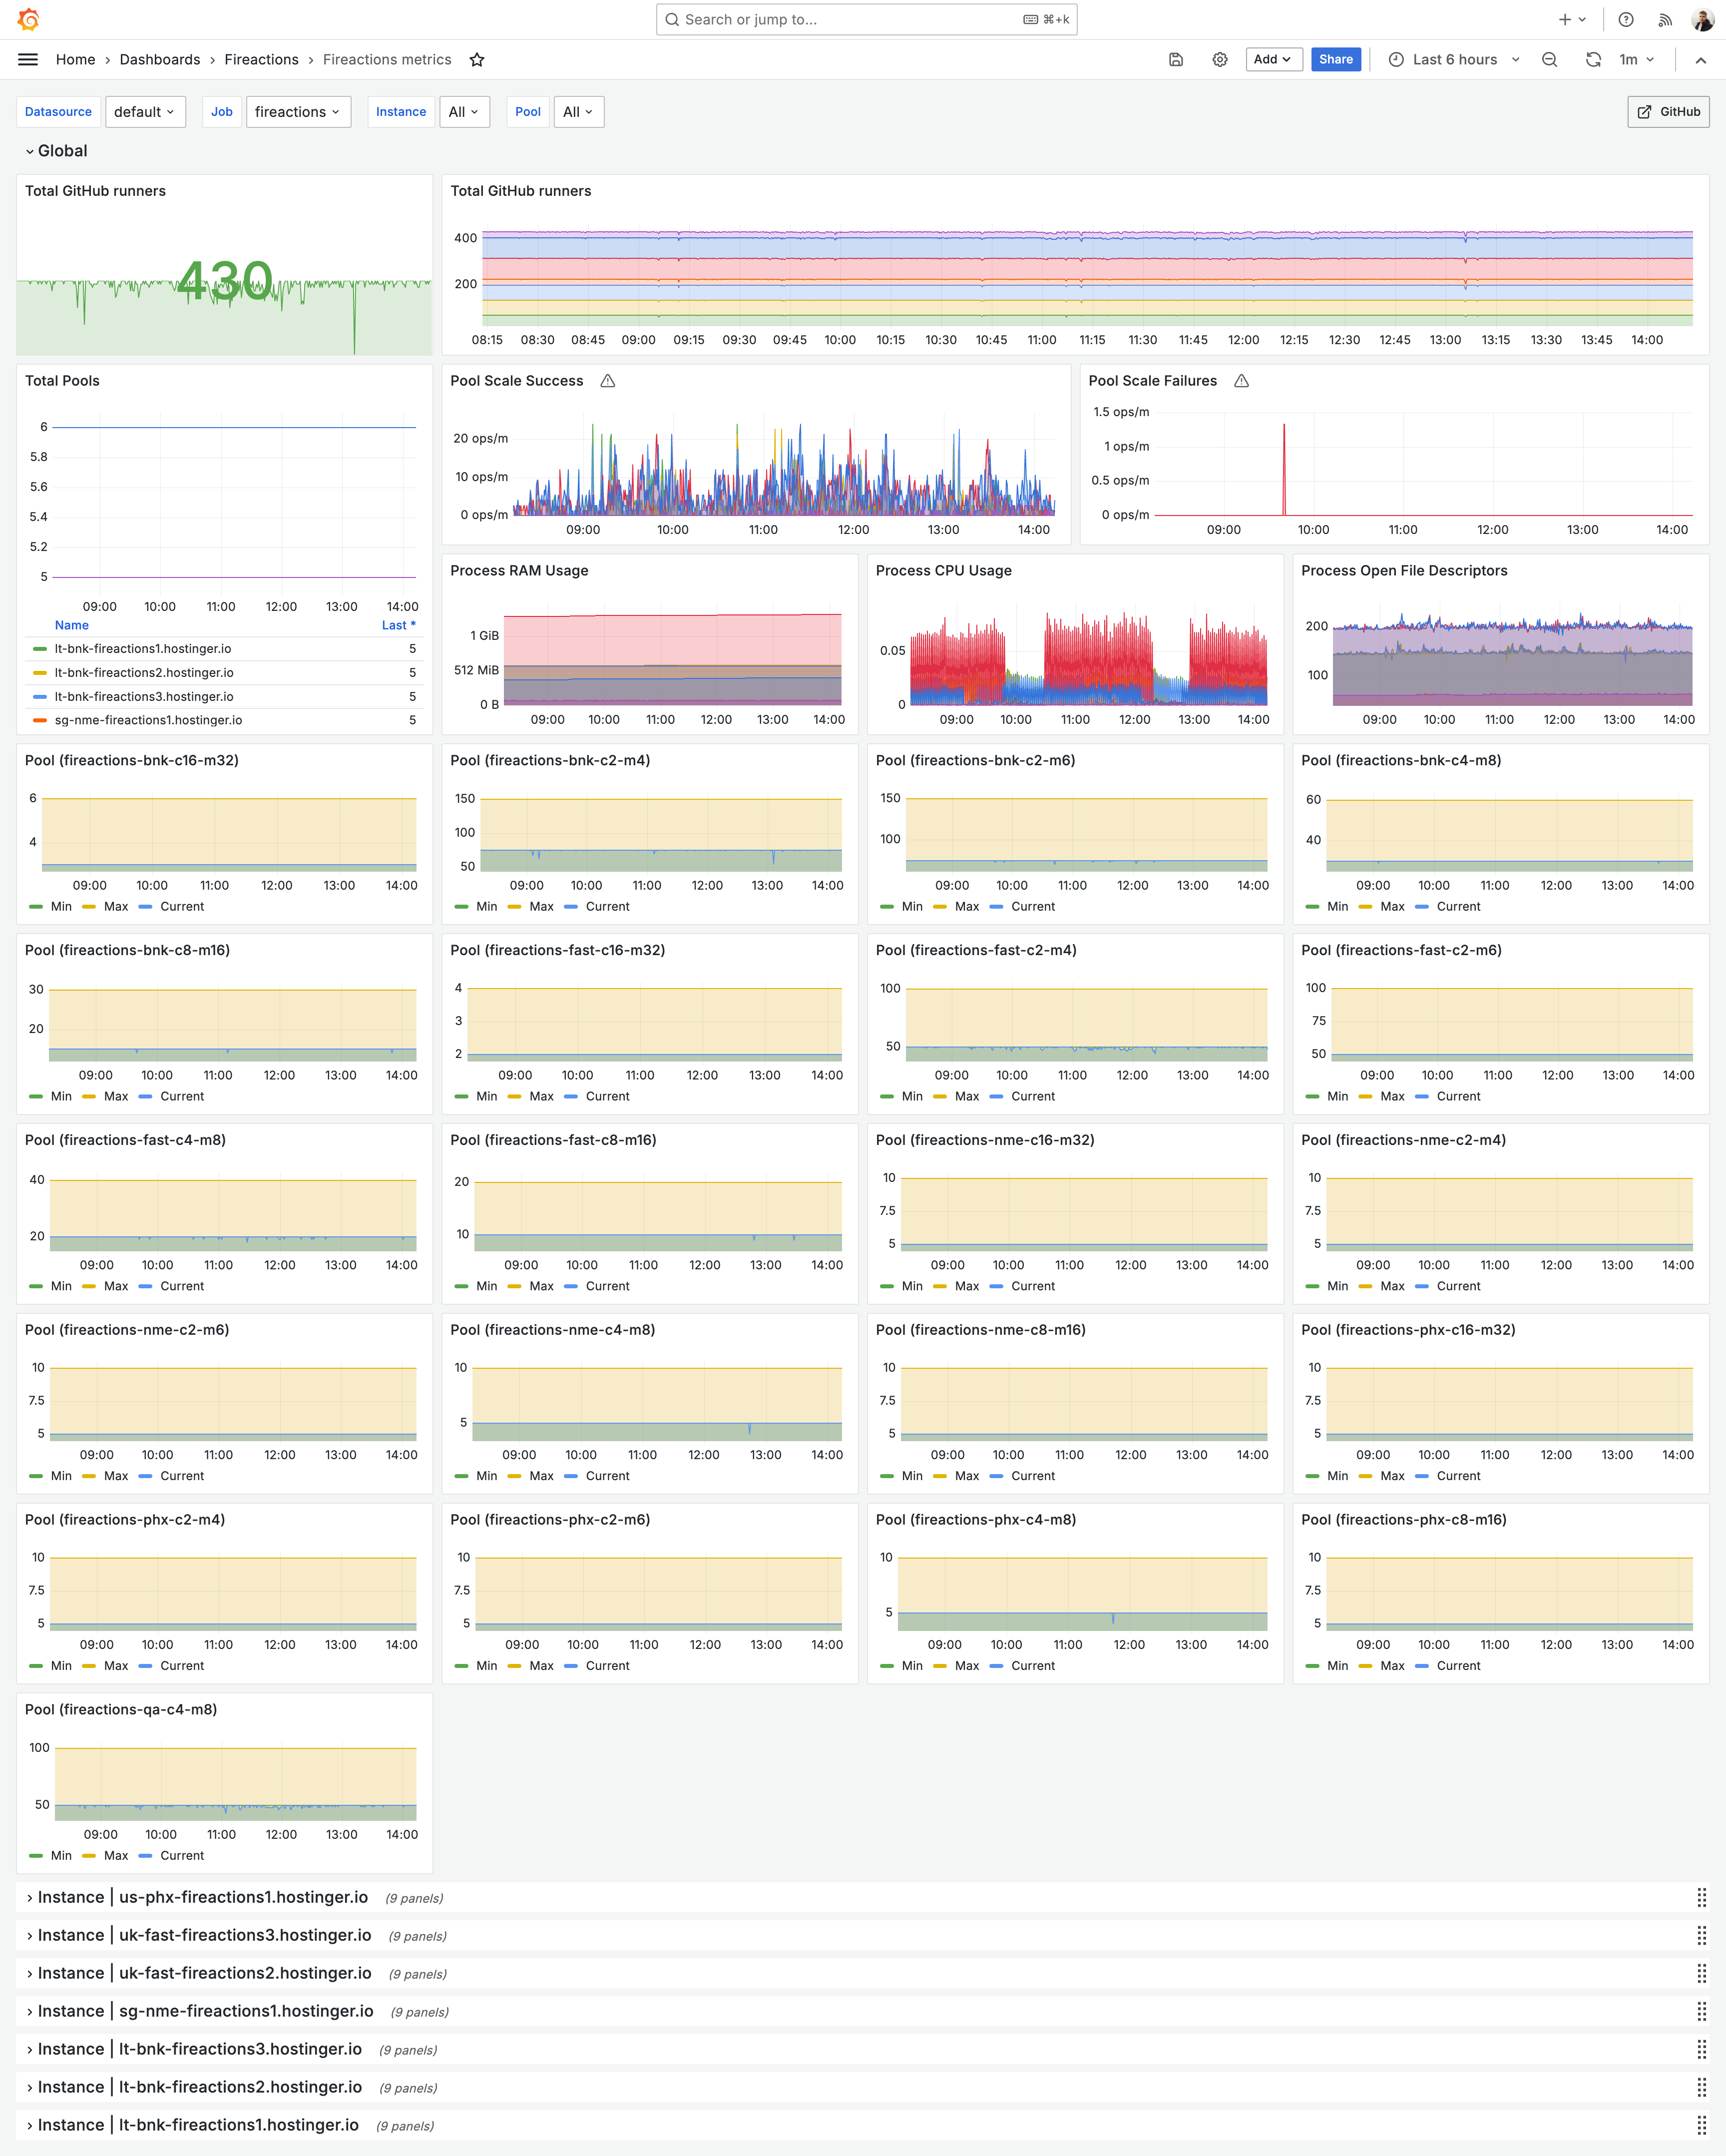
Example Grafana dashboard for vizualisation of Fireactions metrics: